
NBA Props Record Tracking: Monitoring ROI and Performance
 Available in US
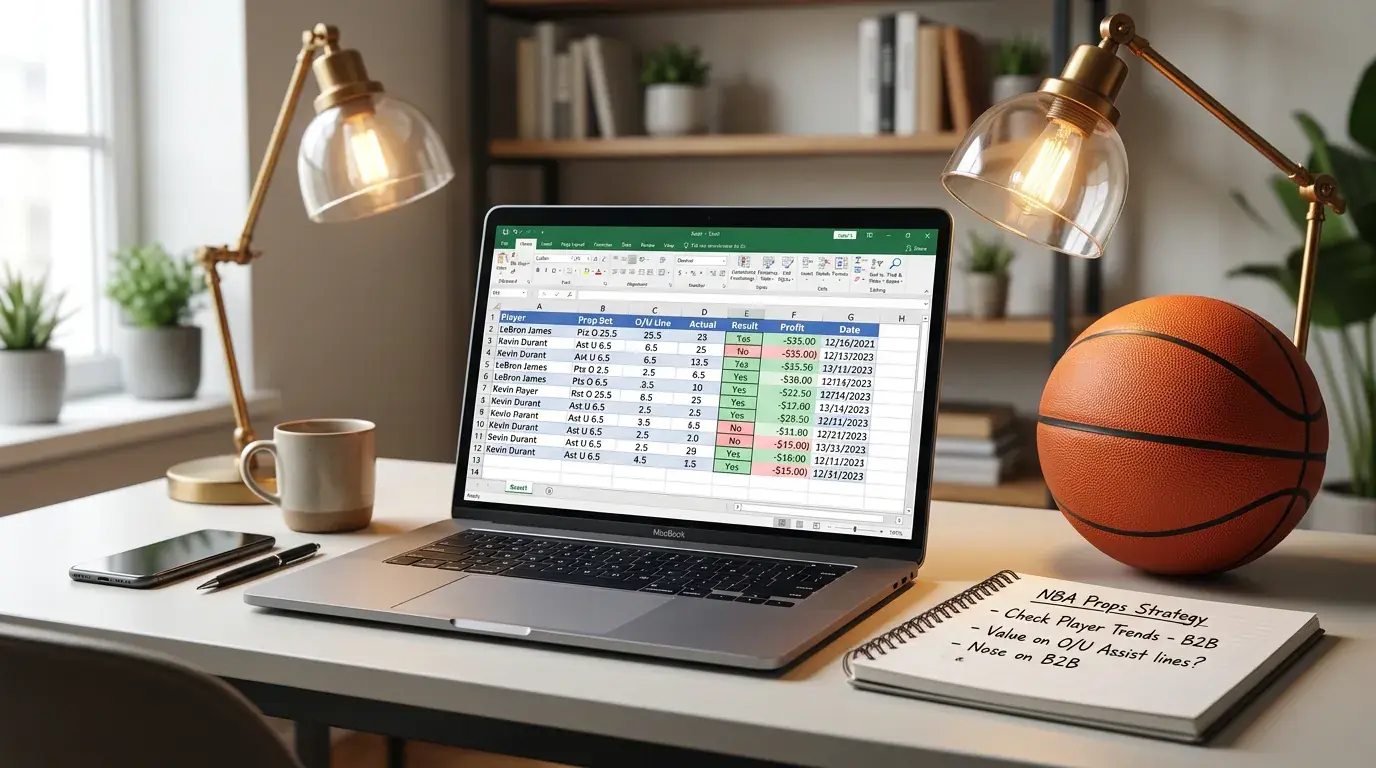
PropStarz achieved a 490-353 record on NBA props over two seasons, generating 75.73 units of profit. Those numbers are impressive, but they are only meaningful because they tracked every bet meticulously. Without records, they would have vague memories of good stretches and bad stretches with no way to analyse what actually worked. Tracking transforms betting from gambling into a process that can be studied and improved.
For my first three years betting props, I kept no systematic records. I remembered winners more clearly than losses, believed I was profitable when I probably was not, and had no ability to identify which analytical approaches generated edge versus which just felt good. Starting rigorous tracking was the single most important change I made. Everything improved once I had data instead of impressions.
Key Betting Metrics for Performance Tracking
Minimum viable tracking includes: date, player, prop type, line, odds, stake, result, and profit/loss. This data lets you calculate win rate, ROI, and total profit – the fundamental metrics for assessing performance. Start here if tracking feels overwhelming; basic information beats no information.
Enhanced tracking adds: sportsbook used, your projected probability, time bet was placed, and relevant context notes. This information supports deeper analysis. You can identify which sportsbooks offer consistently better value, whether your probability estimates correlate with actual outcomes, and whether certain contexts produce better results.
Categorisation enables pattern analysis. Tag bets by prop type (points, rebounds, assists), by player tier (star, starter, role player), by team, by opponent, and by any other factor relevant to your process. These tags let you filter results to identify strengths and weaknesses in specific areas.
I track reasoning for each bet in a notes field. Why did I think this was value? What analysis supported the bet? When I review losing bets, these notes help distinguish between bad analysis (learning opportunity) and sound analysis that variance worked against (keep doing what I was doing). Without reasoning captured, all losses look the same.
Metrics That Matter Most
Win rate tells you how often bets win, but it needs context. Breaking even at standard -110 odds requires approximately 52.4% win rate. Anything below that loses money; anything above profits. But this calculation assumes flat odds – if you bet a mix of favourites and underdogs at various prices, simple win rate becomes less informative.
ROI (return on investment) captures profitability more comprehensively. ROI equals profit divided by total staked, expressed as percentage. A 5% ROI means you profit 5 pounds for every 100 staked. Elite sports bettors achieve long-term ROI between 3-8%; anything consistently above 10% is exceptional or unsustainable.
Units profit normalises results across different stake sizes. If you bet 1% of bankroll per bet as your standard unit, tracking units profit shows performance independent of whether you started with 500 or 5,000 pounds. The 75.73 units profit I mentioned earlier translates to 75.73% of starting bankroll gained.
CLV (Closing Line Value) measures whether you beat the closing line – the final odds before an event starts. If you bet at 1.95 and the line closes at 1.85, you captured positive CLV. Over time, beating closing lines consistently indicates genuine edge even during losing stretches when variance runs against you.
Analysing Your Records
Monthly reviews identify trends that daily observation misses. At month end, calculate your overall metrics and examine breakdowns by prop type, player tier, and other categories. You might discover you crush rebounds props but struggle with assists, or profit on role players but lose on stars. These insights direct where to focus and where to improve.
Compare your predicted probabilities against actual results. If you consistently estimate 55% probability on bets that hit 50% of the time, your confidence is miscalibrated. If estimates correspond to outcomes, your probability assessment skills are sound even during losing periods. This comparison separates luck from skill over time.
Sample size matters enormously for meaningful analysis. Results across 50 bets tell you almost nothing about skill; variance dominates that sample completely. Results across 200 bets begin revealing patterns. Results across 500+ bets provide reliable signal about your abilities. Patience in analysis prevents premature conclusions that lead to abandoning working approaches or persisting with failing ones.
Identify conditions where you perform best. Some bettors excel at early-season props before lines sharpen. Others find edge in high-profile games where information flows more freely. Others perform best on secondary markets that receive less attention. Understanding your strengths helps you allocate time and bankroll toward highest-edge opportunities.
Tools for Record Keeping
Spreadsheets work perfectly for most bettors. Excel or Google Sheets provides all functionality needed for comprehensive tracking. Build a template with your tracking fields, enter data after each bet, and create summary formulas that update automatically. Free and fully customisable to your needs.
Dedicated betting tracker apps exist for those who prefer mobile solutions or pre-built interfaces. These apps handle data entry and automatically calculate key metrics. Some sync with sportsbook accounts to import bets directly. The tradeoff is less customisation versus spreadsheet flexibility.
Whatever tool you choose, consistency matters more than sophistication. A simple system you actually use beats an elaborate system that feels burdensome and gets abandoned. Start basic, expand tracking over time as habits solidify, and prioritise entering data immediately after bets resolve before details fade.
Backup your records. Spreadsheets get corrupted, apps get deleted, devices get lost. A season of tracking data is genuinely valuable – losing it sets you back months in understanding your performance. Cloud storage, regular exports, or other backup approaches protect against data loss.
NBA Props Record Tracking FAQ
What should I track for NBA props?
Track at minimum: date, player, prop type, line, odds, stake, result, and profit/loss. Enhanced tracking adds sportsbook, your projected probability, timing, and context notes. Categorise bets by prop type, player tier, and team to enable pattern analysis. Capture reasoning for each bet to distinguish analysis errors from variance.
What metrics show if I’m profitable?
ROI (return on investment) most comprehensively shows profitability – profit divided by total staked. Win rate matters but needs context since different odds structures require different break-even rates. Units profit normalises results across stake sizes. CLV (closing line value) indicates edge even during variance-affected losing stretches.
How many bets before judging performance?
Meaningful analysis requires at least 200 bets, with 500+ providing reliable signal about your abilities. Results across 50 bets tell you almost nothing – variance completely dominates that sample. Patience in analysis prevents abandoning working approaches during bad streaks or persisting with failing ones during lucky stretches.
The Foundation of Improvement
Tracking is not optional for serious props bettors. Without records, you cannot know whether you are winning or losing, which approaches work, or how to improve. With records, every bet becomes a data point that accumulates into genuine understanding of your edge – or lack thereof.
Start today if you have not already. The next bet you place should be the first entry in your tracking system. Build the habit before building sophistication. Over time, the data you collect becomes your most valuable betting asset – proof of what works that guides future decisions better than any external advice ever could.
Created by the ”nba Bets Props” editorial team.